
How We Built a Data Warehouse Using ClickHouse
When the scripts that generate the data for letsencrypt.org/stats broke yet again, we decided to retire it rather than repair it. Let’s Encrypt issues six to ten million certificates each day, producing a large volume of logs that keeps growing. It became increasingly time-consuming and difficult to answer questions about our own issuance like “how many certificates use the ‘shortlived’ profile.” Using raw logs, this requires finding, parsing and extracting relevant portions of loglines. Querying the database behind our issuance API is not a practical option, as it’s built for transactions rather than analysis. We’d also used a log search SaaS product, but our bills were growing much faster than we’d like, and while it was fine for searching, it wasn’t able to do the analytic workloads we needed. We knew we could dream bigger and better.
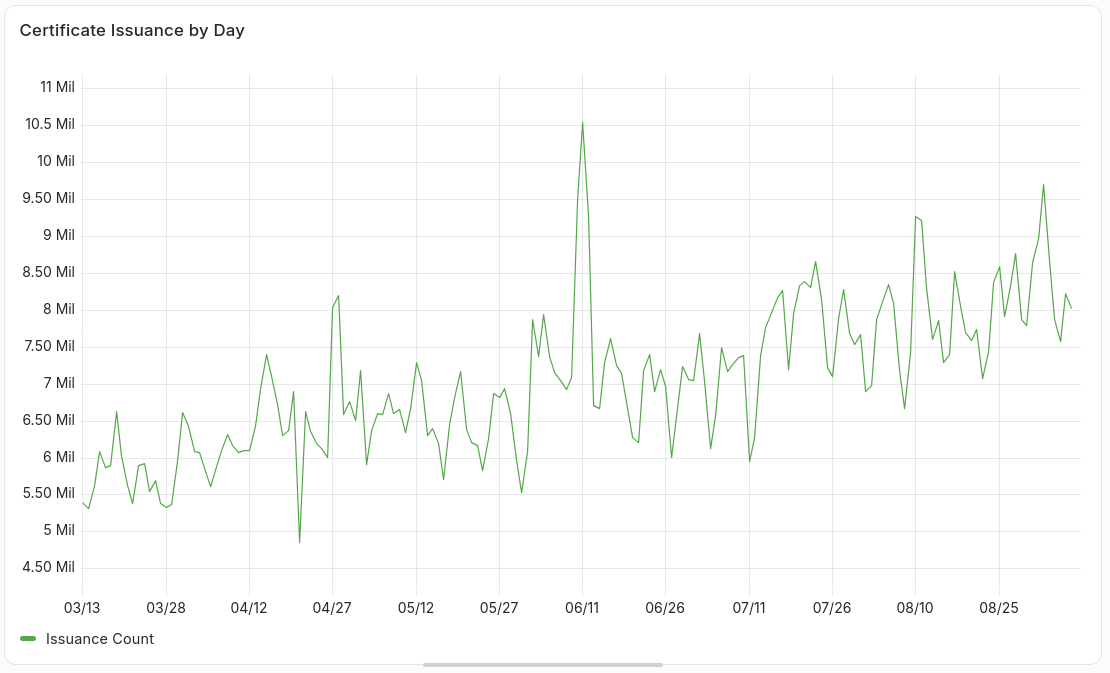
This led us to seek a self-hosted solution with efficient storage for structured data in addition to logs. We chose ClickHouse because of its potential as a data warehouse; the combination of cost-efficient storage and fast aggregation over large datasets appealed to us. A bonus of ClickHouse is that it is open source, a key principle valued by Let’s Encrypt.
The first step in building our new infrastructure was to purchase new hardware. To back our ClickHouse warehouse, we bought three PowerEdge R7715 servers. Each is equipped with a 32-core AMD EPYC 9355P 3.55GHz processor, 384 GB of RAM and 32 × 3.2TB NVMe drives, working out to roughly 100TB raw storage. With structured data and 100 days’ worth of logs already in our database, we are only at ~14% of total capacity, leaving lots of room for future growth.
Logs are the bulk of our storage use and the foundation of our structured data, as every other table we build is derived from them. When it comes to log search, ClickHouse covers our basic needs with quick ingest and interactive SQL. However, there are query ergonomics that we want to improve, like using OpenTelemetry’s tracing features and ClickHouse’s tokenization settings.
Our primary target for structured data are our issuance records. A materialized view extracts those records from logs into their own table, and further views pre-aggregate from there. One such view counts issuance by day per profile. Now, questions like “what is our issuance by profile over the last 180 days” can be answered within milliseconds.
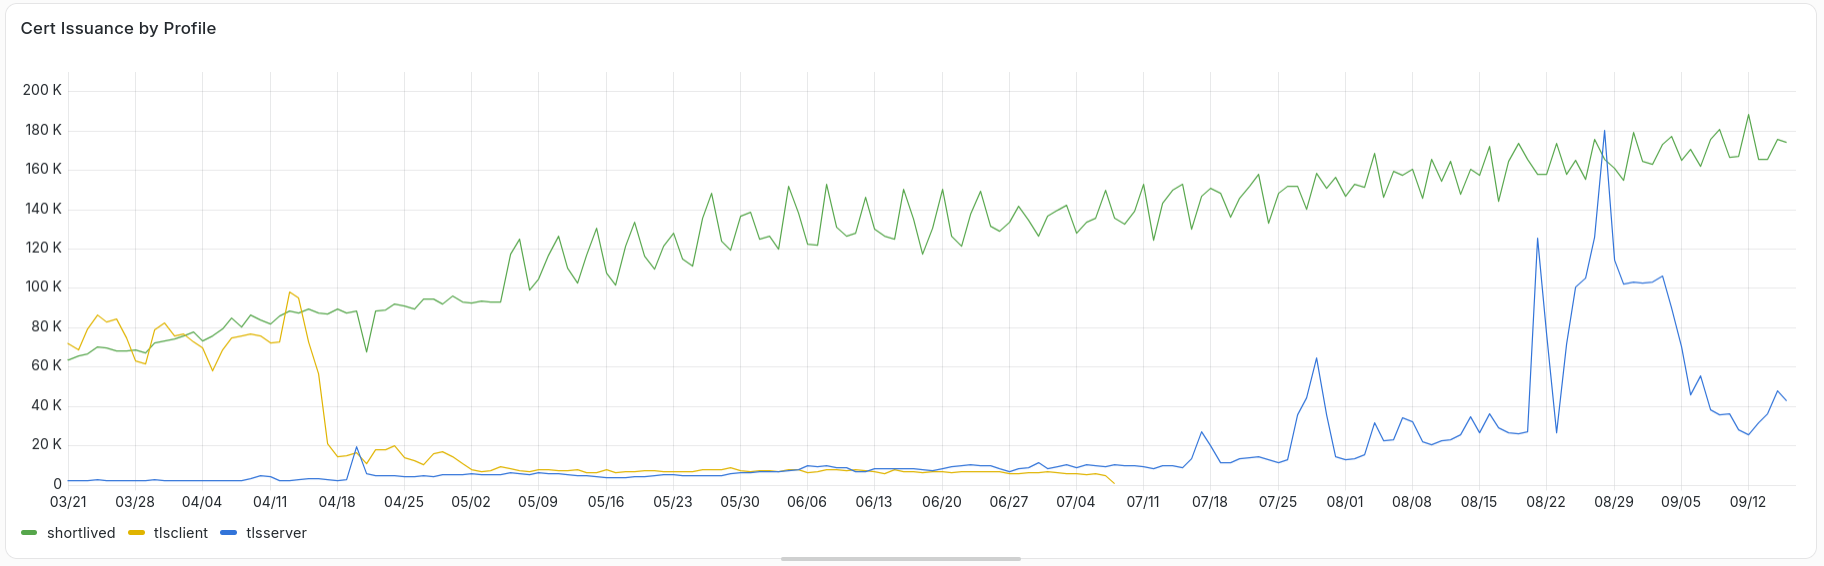
We used this approach to completely rebuild the pipeline for our public stats page. The scripts we abandoned used to take hours each day to read and process dozens of compressed data files. The Rube-Goldberg-Machine-like collection of steps failed several times a year, requiring us to intervene and fix it. ClickHouse now computes those same stats in less than 10 seconds. Aside from pre-aggregated issuance tables, we can accomplish this because ClickHouse’s native functions are capable of quick and complex aggregations. Below is a simplified snippet of our materialized view for daily stats, counting the unique set of active domains over months across millions of rows. Two things to point out about this query: array handling means we can query nested fields without reshaping the underlying data, and uniq uses approximations to stay fast at scale.
SELECT
uniq(arrayJoin(arrayMap(x -> x.value, arrayFilter(x -> x.type = 'dns', identifiers)))) AS fqdns_active,
uniq(arrayJoin(etld_plus_one)) AS reg_domains_active
FROM boulder.cert_issuances
WHERE not_before >= yesterday() - 90
 AND not_after >= yesterday()
 AND not_before <= yesterday()
Our ClickHouse issuance data also addresses the previous headache of identifying affected certificates during incidents. It used to take hours of engineer time to correctly scan and parse logs to find the affected set of serials or hours of computing time to return results from database queries, competing with production transactional load. Now, however, there is no log wrestling required, and because queries return quickly, we can iterate toward the right one in minutes rather than hours.
Not everything we needed came with ClickHouse. For scheduled reports, we built our own custom tool that queries ClickHouse and exports formatted results. It cost additional engineering time to design it to fit our needs, but we’ve seen payoffs already. Old reports were clunky to read and required chasing down context by hand. New reports, on the other hand, streamline security reviews via neat formatting and linking directly to relevant pages. The same reporting tool was repurposed for our revitalized stats pipeline as well.
The biggest challenge was backfilling data. While OTel collector handles live log ingestion well for us, it didn’t suit the task of backfilling historical logs. We couldn’t find throttling settings that handled the bulk import reliably – a large portion of files were silently dropped – and the alternative meant breaking up the import by hand. We instead switched to ClickHouse’s native S3 import method, standing up an S3-compatible gateway in front of our old logs to do so. While this avoided the earlier obstacles, this process required trial and error to match ingestion rules to OTel collector’s parsing to ensure the ingested logs matched regardless of whether they were backfilled or streamed in. Two lessons: don’t run bulk historical imports through a streaming collector, and match parsing rules across paths before you start.
One schema decision made these iterations cheap. For tables we anticipated requiring backfilling or recalculation, we deliberately chose the ReplacingMergeTree engine, so re-ingesting corrected rows simply replaced the old ones. This also came in handy for a materialized view computing aggregations across other rows. We got the calculations wrong more than once, and each time all we had to do was re-run the query rather than surgically remove bad rows. For tables without the engine, we did OPTIMIZE TABLE ... DEDUPLICATE BY, which was expensive, but only needed to be run once.
We hope that this is just the start, especially with our shorter certificate lifetimes and post-quantum certificates on the horizon. We plan to take full advantage of our new warehouse, extracting and pre-aggregating data that answers questions other teams care about, the way we did for issuance. Better analysis improves our operations and makes transparency cheaper, as our rebuilt stats page shows.
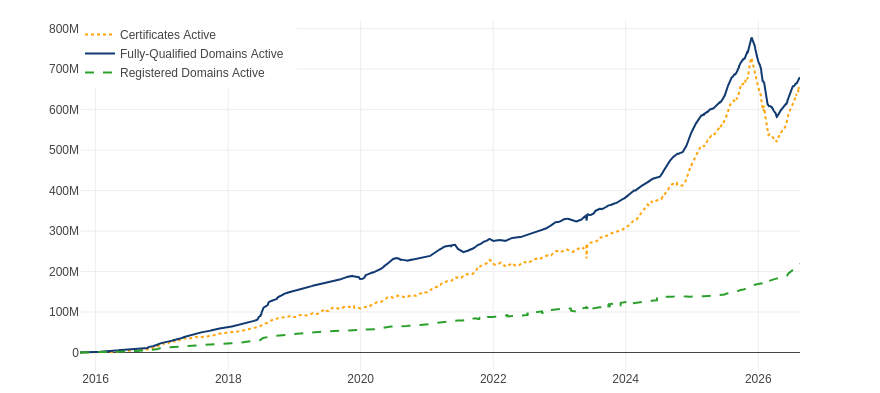
With powerful analytics in hand and only ~14% of our storage in use, we have room to store and analyze more than ever before.